Integration with Datadog
CodeSee's Service Maps integrates with your existing Datadog Agent infrastructure to generate complete maps of your application.
Service Maps is an Enterprise-only feature
Backend:
Note: These instructions assume you have already enabled APM Tracing in Datadog. Learn more here.
There are 2 ways to integrate Datadog with Codesee:
- Recommended - Use Datadog Dual Shipping if your Datadog Agent version >= 6.17 or 7.17.
- Use CodeSee dd-bridge if your Datadog Agent version is older than 6.17 or 7.17.
Option 1: Datadog Dual Shipping (Recommended)
First, make sure you have APM enabled and are allowing non-local traffic. This can be done with environment variables:
// Ensure tracing and metrics are enabled
DD_APM_ENABLED=true             // turns on tracing and metrics
DD_APM_NON_LOCAL_TRAFFIC=true   // necessary in most environments
Second, enable "additional endpoints" to send data to CodeSee. In order to set "additional endpoints", you can either:
- modify your
datadog.ymlfile, - or set the
DD_APM_ADDITIONAL_ENDPOINTSenvironment variable:
If modifying the datadog.yml file, be sure to replace <CodeSee_Ingestion_Token> with your token:
apm_config:
  additional_endpoints:
    "https://in-datadog.codesee.io":
    - <CodeSee_Ingestion_Token>
If setting the DD_APM_ADDITIONAL_ENDPOINTS environment variable, be sure to replace <CodeSee_Ingestion_Token> with your token (in double-quotes):
DD_APM_ADDITIONAL_ENDPOINTS={"https://in-datadog.codesee.io": ["<CodeSee Ingestion Token>"]}See full example here: https://github.com/Codesee-io/examples/tree/main/docker-datadog-dual-shipping-example
More information about Datadog Dual Shipping: https://docs.datadoghq.com/agent/guide/dual-shipping/
Option 2: dd-bridge
Deploy the CodeSee Datadog Bridge docker image (dd-bridge) in each of your network environments. It is a very simple bridge process which receives Datadog-bound APM traffic (traces + metrics) and forks that traffic to both Datadog and CodeSee.
The dd-bridge docker image is available at https://hub.docker.com/r/codeseeio/dd-bridge. We encourage you to use the latest tag in order to more easily get updates.
docker pull codeseeio/dd-bridge:latestThe dd-bridge image:
- is an x86 image
- listens on port 8080
- needs to have outgoing https network access so it can send data to Datadog (datadoghq.com) and CodeSee (in-datadog.codesee.io)
Deployment architecture
The dd-bridge can be deployed as a daemon along with each Datadog Agent, or on its own instance(s) with all Datadog APM traffic being routed through it.
Or, if you use AWS Lambda with the Datadog Lambda Layer, there is a DD-Bridge Lambda Layer you can use as well.
You may decide to deploy dd-bridge with a load balancer and redundancy if you are concerned about throughput / uptime.
Here are a couple of possible deployments:
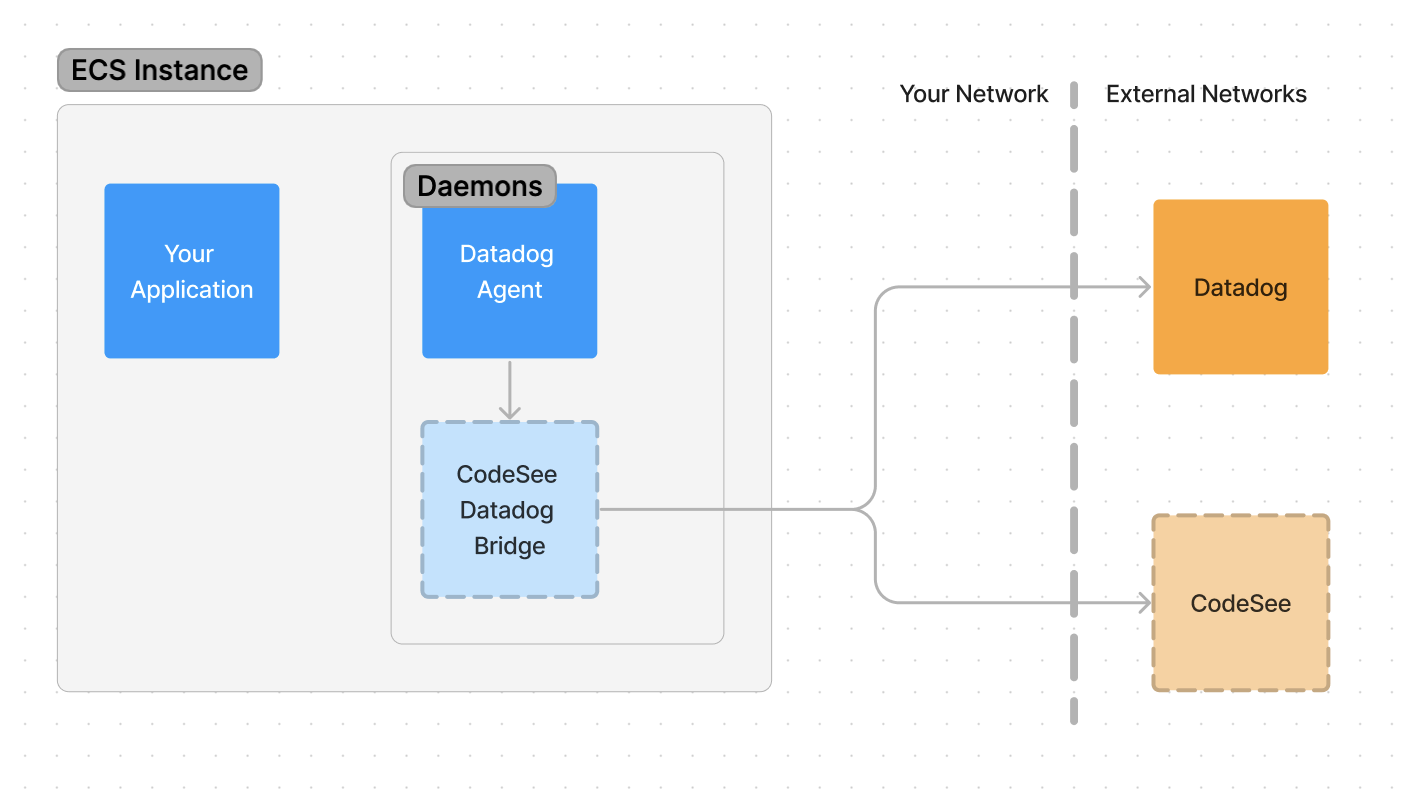
Simple daemon deployment
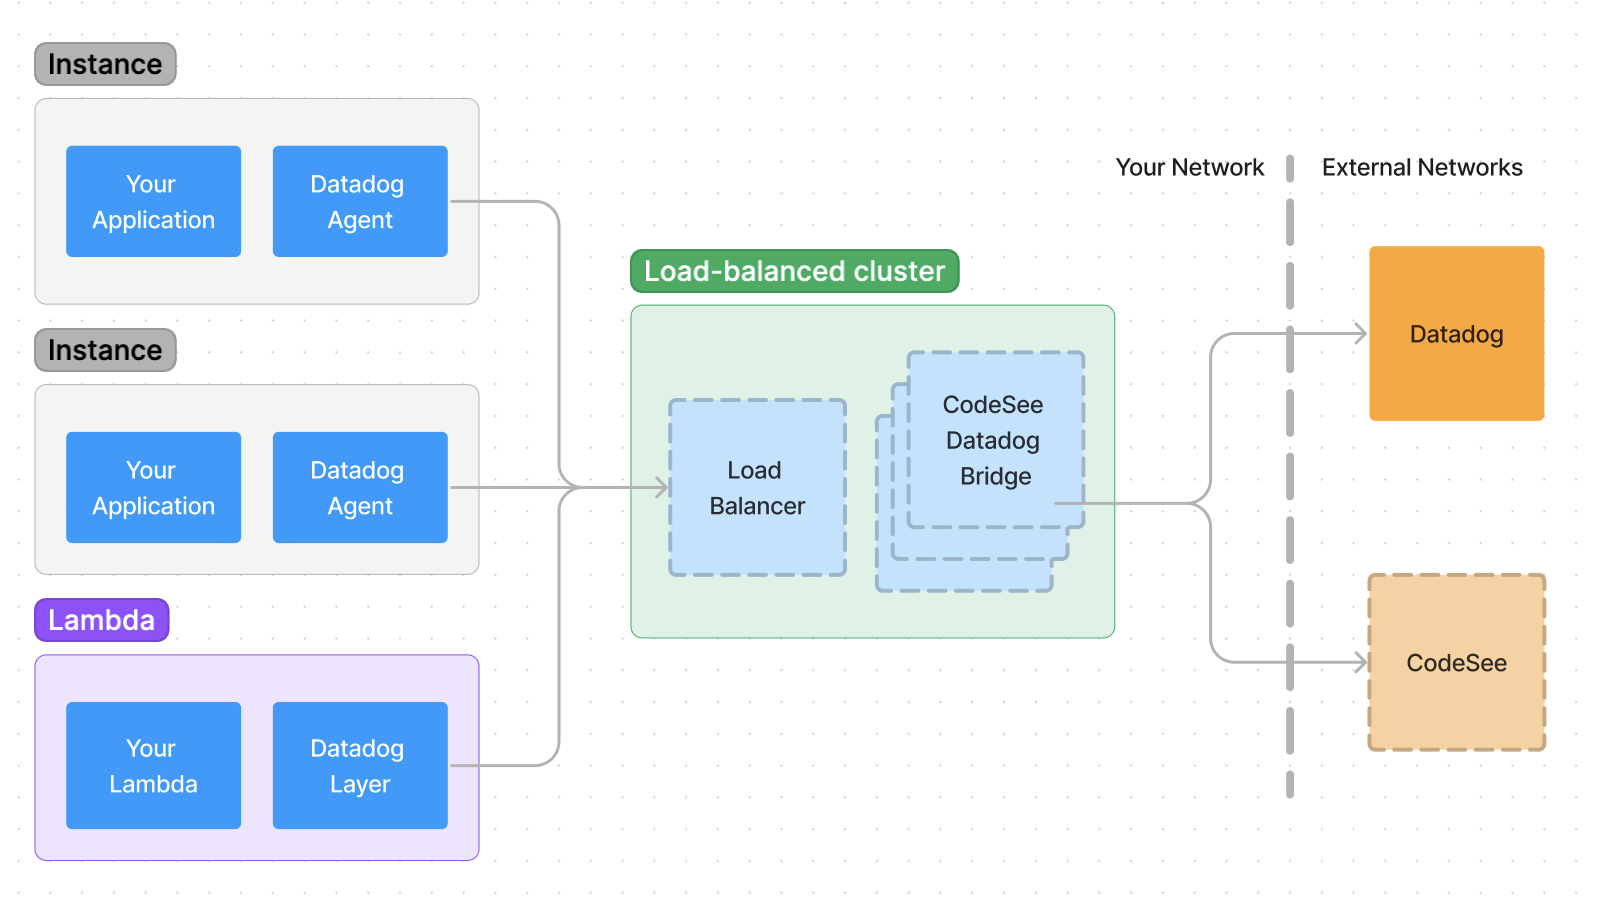
Deployment with central cluster and redundency
Configuration
Datadog Agent / Layer configuration
Note: this is exactly the same for Datadog Agent and AWS Lambda Datadog Layer.
// Ensure tracing and metrics are enabled
DD_APM_ENABLED: true             // turns on tracing and metrics
DD_APM_NON_LOCAL_TRAFFIC: true   // necessary in most environments

// send trace and metric data to CodeSee dd-bridge+
DD_APM_DD_URL: <location of dd-bridge>

// For example, if running dd-bridge locally
DD_APM_DD_URL: http://localhost:8080
CodeSee dd-bridge configuration
CODESEE_BRIDGE_TOKEN: <CodeSee Ingestion Client Key>
CODESEE_BRIDGE_FORWARD_HOST: https://in-datadog.codesee.io

// If you have a private datadog endpoint
CODESEE_BRIDGE_DD_HOST: https://your-private.datadoghq.com

// If you are using EU endpoint
CODESEE_BRIDGE_DD_HOST: https://trace.agent.datadoghq.eu
Examples:
Frontend
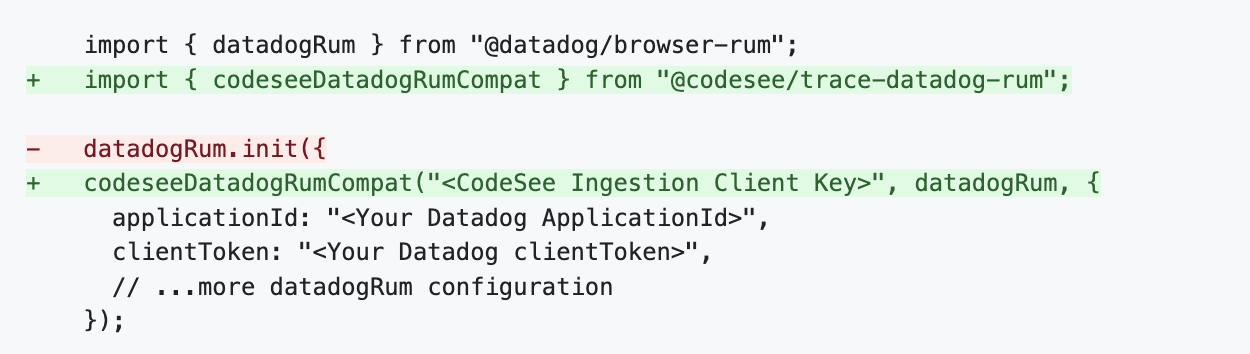
Install and configure the @codesee/trace-datadog-rum package in each of your frontend browser codebases. Full details are in the project README.
Example
Update CSPs
If you use Content Security Policies (CSPs) you may need to update them to allow the browser to send trace data to CodeSee at https://in-datadog.codesee.io
connect-src https://in-datadog.codesee.ioConfigure allowedTracingUrls
Datadog tracing will only be initiated from the frontend when making requests to allowed tracing urls. These urls must be configured, or no traces will be recorded. Follow the Datadog Rum instructions to configure the allowedTracingUrls initialization parameter.
Updated about 1 year ago