The Service Map
Finally, a map of your whole system that anyone can use to understand what the heck is going on!
Exploring your Service Map
What's going on in this diagram?
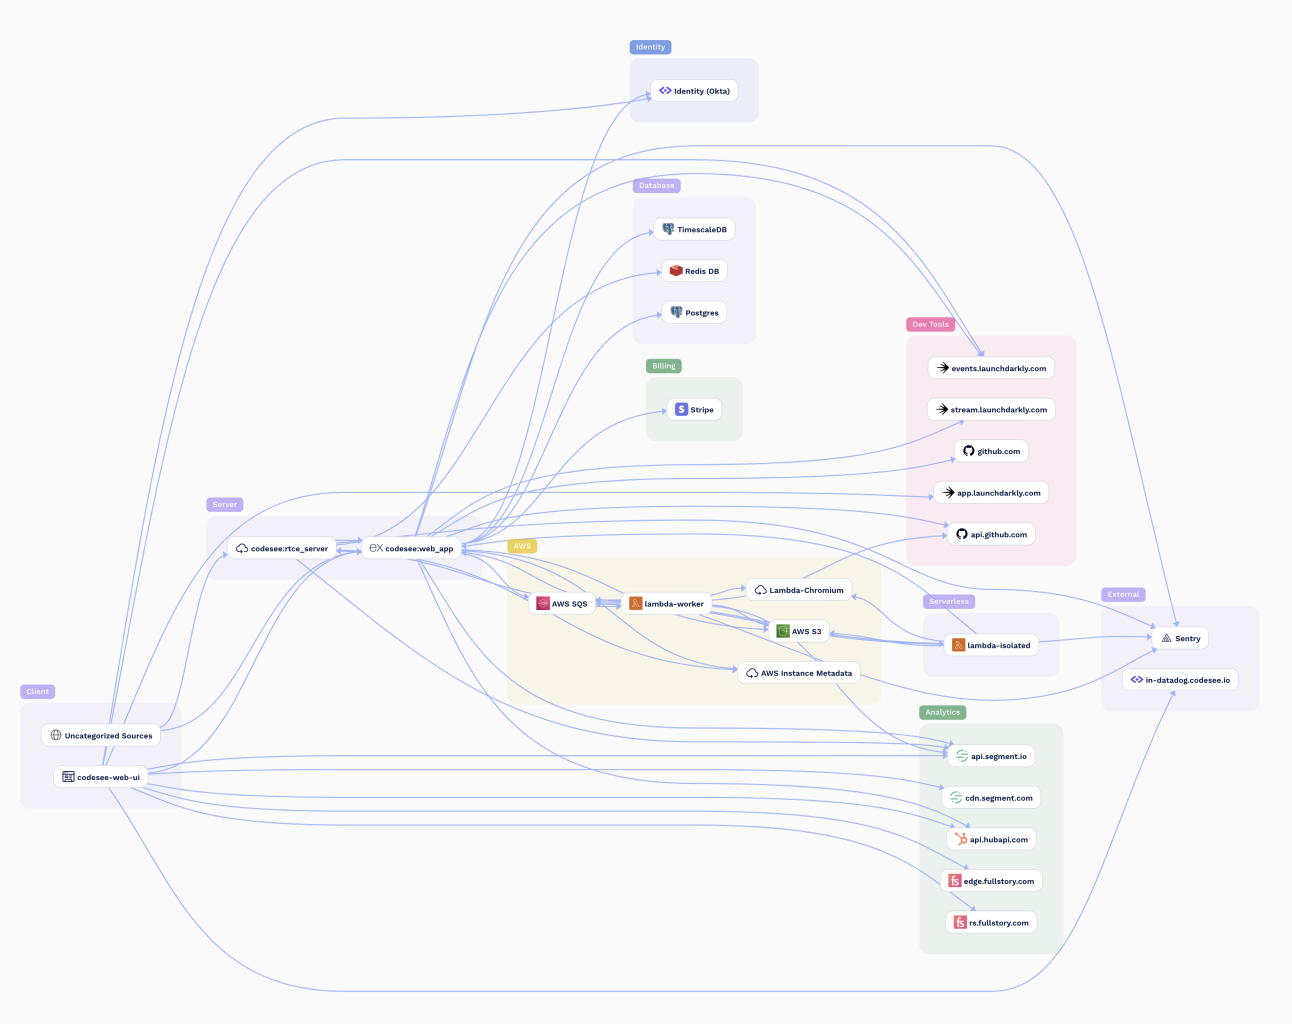
This map itself has two types of nodes and a bunch of connections between them:
- Some nodes represent services in your system. Often these are instrumented by your tracing technology. But sometimes they are only implied! You may not have instrumented your database, or your S3 buckets, but CodeSee can infer these nodes exist as part of your system.
- Some nodes represent external APIs or SaaS products that your system interacts with. CodeSee detects that your system is using these APIs and visualizes them as an important part of your system. After all, when they go down, it often affects your system as well!
- Each connection between two nodes represents that requests are being initiated: from the base of the arrow, to the head of the arrow. The arrow for an HTTP request always starts with the referrer and points to the service making the response. Similarly for any kind of db query, or other API request.
The active environment and time window

You can filter your map to a single environment (production, staging, etc), and a time window (past hour, past day, past week, etc). Your map will only display services, connections, endpoints, flows, and variants that were detected during that time window.
Choosing your time windowFor a fast-changing application, a short time window can be very helpful to see the most up-to-date version of your map. But beware! If a particular call wasn't made during that window (maybe it only occurs once a week), it won't appear on your map.
To make sure you see every detail of your system, a longer time window can be very helpful. But beware! You may see parts of the system that are no longer active.
Dive into a service
Click on a service, and the right-panel will slide open with helpful details about the service.
The "Info" tab
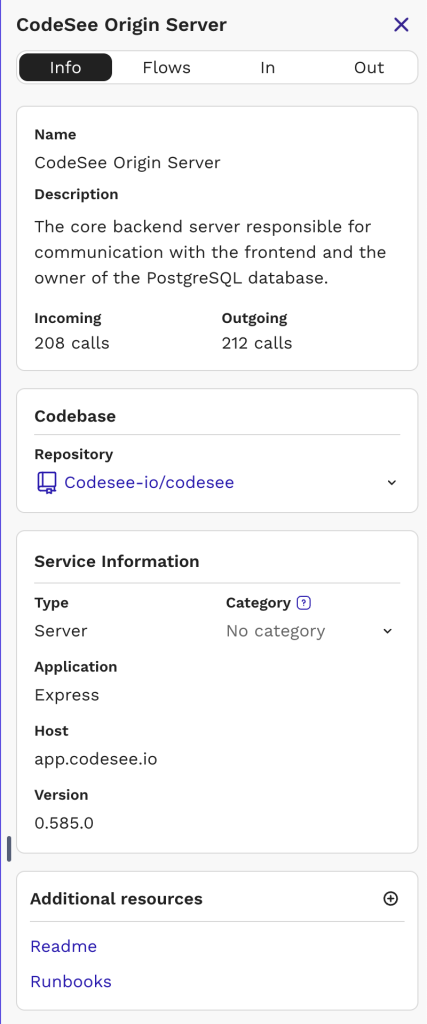
The "Info" tab is a high-level overview of the selected service.
Users with write privileges can customize the service's name, description, repository, category, as well as add additional resources.
The tab displays a count of unique incoming and outgoing "calls" that have been detected within the active time window. You can see more detail about each in the similarly named tabs: "In" and "Out".
The "Flows" tab
To really understand how this service is incorporated into your application, you need to see which Flows through your application use this service.
Think of a Flow as a single end-to-end execution through your system. Click on any Flow to see a full flow diagram of execution.
Flows, Variants, entry points, and origins are a big topic, so we made a whole page all about them. Check it out!
The "In" tab
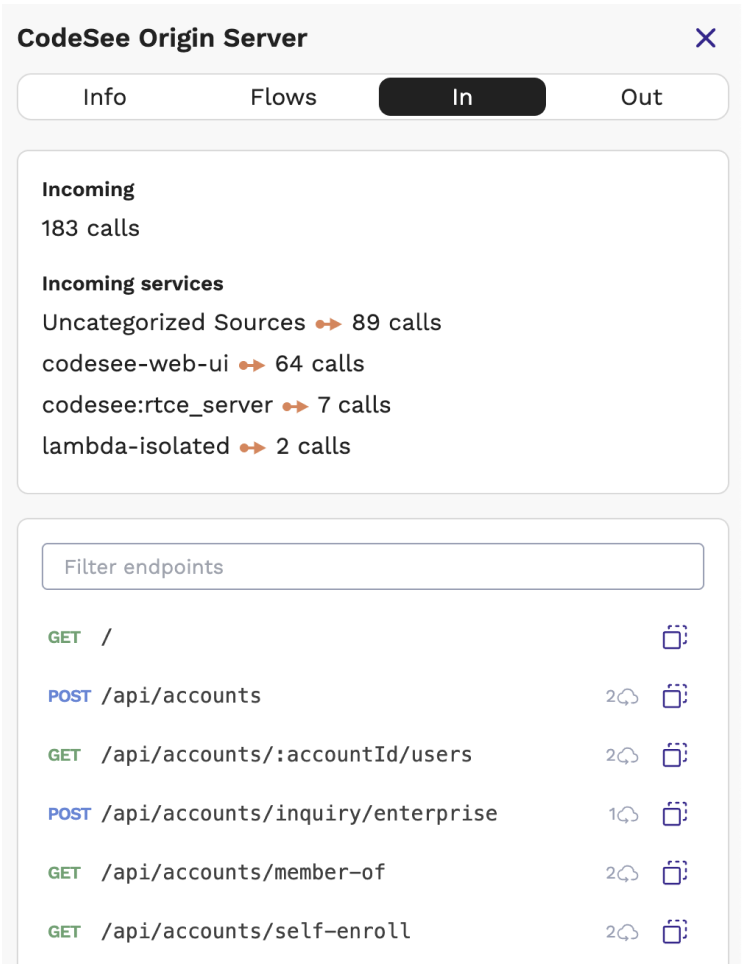
The "In" tab provides details about the incoming traffic to this service: the API that this service exposes and the ways other services are using it.
Incoming services
This section is a list of each service that makes calls to the selected service, and how many unique API endpoints (calls) it uses.
Endpoints
A list of each endpoint detected during the active time window. The number + cloud icon indicates how many different services used that endpoint during the time window.
Click on any endpoint to dive in:
- See more details on the endpoint: for example a complete sql or graphql query
- See which services use this endpoint, and some example requests from each service
- Any associated Flow
The "Out" tab
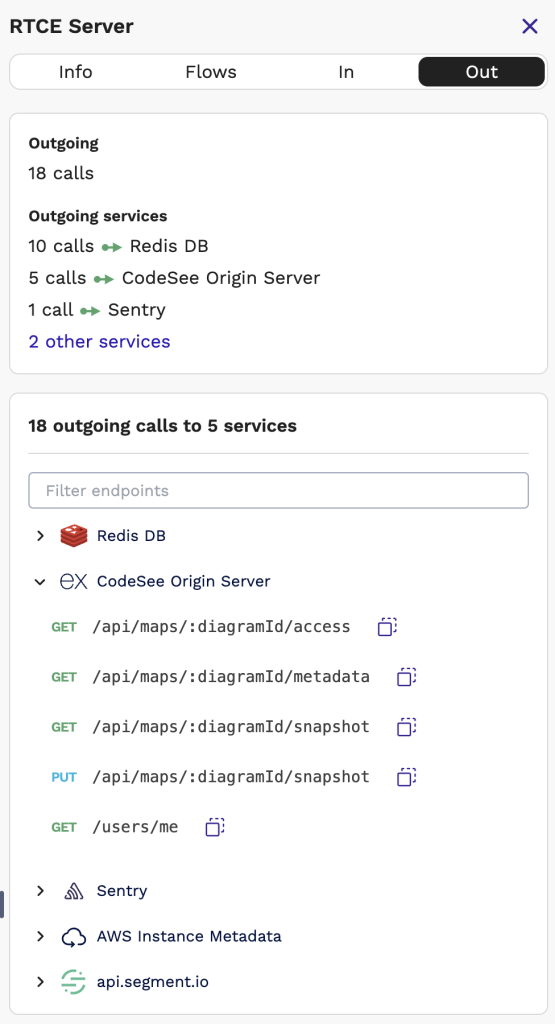
The "Out" tab is just like the "In" tab, except it provides details about the outgoing traffic from this service: what other APIs is this service using?
Outgoing services
This section is a list of each other service that the selected service makes calls to, and how many unique API endpoints (calls) it uses.
Endpoints
A list of each API call detected during the active time window. Calls are grouped by destination service, so you can easily see every API call being made between the selected service and any one of the outgoing services.
Click on any endpoint to dive in:
- See more details on the endpoint: for example a complete sql or graphql query
- See some example requests from each service
- Any associated Flow
Personalizing your Service Map
Categories
Services are organized into colored regions called "Categories".
Default Categories
By default, each service is put into one of the default Categories based on its autodetected Type: Client, Server, Database, etc.
Custom Categories
You can further organize your Service Map by creating custom categories and assigning each of your services.
To create a new category
- Select a service, make sure you're on the Info tab, then click on the dropdown below Category, and click Manage Categories
- Click the Add a Category button
- Give your new category a name and color
To assign a service to a category
- Select a service, make sure you're on the Info tab, then click on the dropdown below Category
- Select the category you want this service to be in, and the service will move to that category.
Hiding Categories
Sometimes, you may want to focus in on just some of your map. The left panel has a Services tab where you can hide or show any category from your map.
Names and Descriptions
Services
Flows and Variants
Resources
Updated about 1 year ago